
Here’s your Massachusetts real estate market update for April 2024. Last month’s data suggests a correction in two markets where price gains pulled back, while one market segment saw an increase in the appreciation rate. Massachusetts’ real estate market continues to be one of the strongest in the country, with strong performance in single-family homes, condos, and multi-family properties.
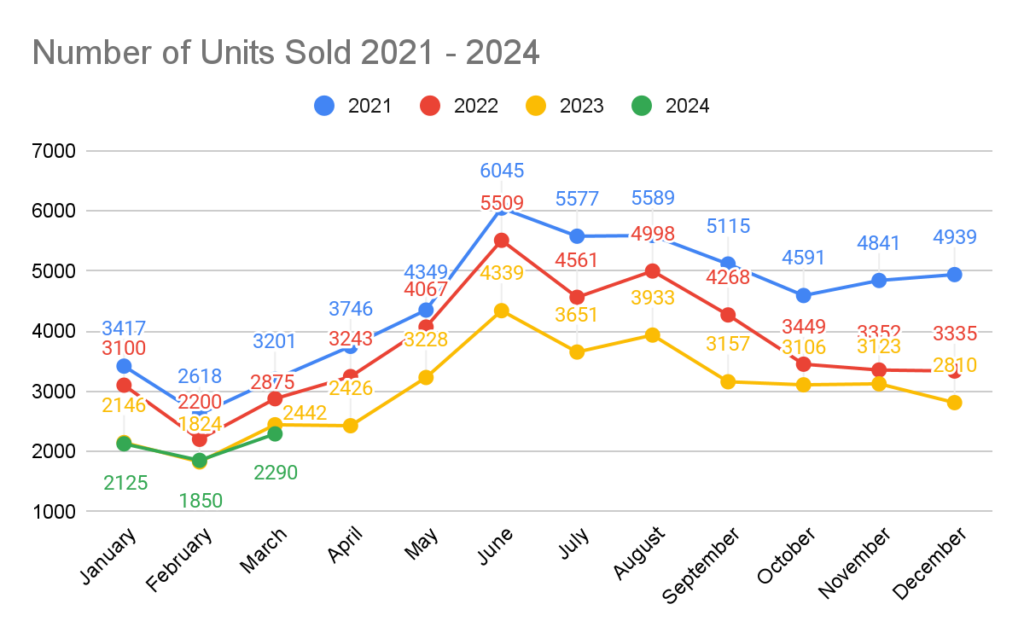
The spring market began a little earlier this year, and it shows signs of significant strength, despite interest rates not decreasing. In March of 2024, we saw 2,290 single-family homes sell for an average sales price of $771,000. While this fell slightly short in sales, the significant news is a revision to the February data.
The 2,290 single-family homes sold in February were 6.2% off of last year’s sales numbers, meaning that sales levels in 2024 continue to mimic those in 2023. However, sales levels and prices do not always correspond. Home values are tied to inventory levels, not sales levels.
The rate of year-over-year appreciation dropped a bit from February levels, but still showed a respectable 7% year-over-year appreciation rate for March 2024. With the first quarter of 2024 now over, we’ve seen prices increase 8.5%. In other words, the single-family home price in Massachusetts has risen by 8.
YOUR Massachusetts Real Estate Market Update for April 2024
There is some big news from let’s call it a correction from last month’s data. Two markets saw the price gains pull back while one market segment saw the appreciation rate grow.
The Massachusetts real estate market continues to be very strong… One of the strongest in the country.
If you are looking to hear about the Massachusetts Real Estate Market data for Single Family Homes, Condos and Multi-Family properties… Then you are in the right place.
The Spring market started a little earlier this year and it’s off to a big start. This is going to be a very strong Spring market, even with interest rates not going down. I am personally still in the camp that the FED doesn’t cut in June, but time will soon tell.
I continue to be in the camp that the FED can’t lower interest rates. If they do, then the cost of housing is going to skyrocket and lead to more inflation. I was relieved to finally hear others start talking about this as recently Barbara Corcoran started to talk about economic common sense.
Real quick, my name is Jeff Chubb and I am a recovering Investment banker, turned real estate agent that has sold more than a 1,000 homes. If you are planning on buying or selling a home now or in the future, then it would be a pleasure to speak with you.
Let’s start with Single Families
In March of 2024, we saw 2,290 Single Family homes sell for an average sales price of $771 thousand dollars.
We fell a little short in sales, but the big news is actually a little revision to the February data. More on that in a moment.
The 2,290 Single Families that sold in February was 6.2% off of last year’s sales numbers when we saw 2,442 homes sell.
The big takeaway is that the sales levels of 2024 continue to mimic the sales levels that we saw in 2023. This will be a very similar sales level year as 2023.
But as we very well know, sales levels and prices do not work in tandem. Home values are tied to the inventory levels. Not sales levels.

The rate of year over year appreciation dropped a bit from the levels that we saw in February, but still showed a very respectable 7% year over year appreciation rate for March of 2024.
With three months down, we have now seen prices increase 8.5% in 2024. In case you missed that. One quarter of 2024 down and we are seeing the Single Family home price in Massachusetts go up by 8.5%.
Now onto the yearly sales comparison levels.

As I said earlier, we fell short of last year’s sales levels. The 2,290 single family home sales put us within the 2011 sales level range.
This has ultimately become the norm and it’s going to continue to be this way for some time. It’s time for people to stop looking at these sales levels as a negative. The higher interest rates are keeping people in their properties longer. That’s not necessarily a bad thing for those property owners.

We knew that the streak would break… Last month I had talked about how I felt it was going to be the February data that was finally going to kick the 30 month year over year sales decline streak. Well…
As data continued to trickle in after we did our video, it turns out that February was THE month when the year over year sales decline streak came to an end!
This month we are back to old habits with our 6% year over year sales decline… But the streak of sales declines have come to an end! We can expect to see this year over year sales levels graph to go up and down for the next year. I don’t really see the trend of long term streaks either way in the future.

The year over year sales decline trend may have broken, but the price increase streak didn’t!
Make that 45 consecutive months of price increases.
I’ve said it before and I will say it again. I don’t see any way that this trend comes to an end this year. Just three more months and it will be an official 4 years of pricing gains.
It’s simple economic math. Prices are going to continue to go up and up because of inflation. It’s that simple. For as long as the government is printing trillions of dollars, then home prices are going to continue to go up and up and up.

We don’t play with the data here… So this chart is correct, but I have to say there really needs to be a big asterisk next to this.
Year over year, our inventory levels are down 14% for March. But this decrease that we saw in 2024 is thanks to Easter weekend being at the end of March. New Listings were down in the last week of March which pushed the overall inventory levels down. That inventory number saw a big pop above the 2023 levels after the first week in April.
I know it doesn’t really show it here, but the inventory trend is one that inventory levels are increasing. And it’s something that we should really keep our eyes on.

Carry over what we were just talking about in regards to the inventory levels and how they are kind of artificially low for the end of the month. You can really see it here as the blue line has been above the red line for all of March. And the levels were actually growing.
That pullback was just thanks to Easter. April will be an interesting month. What does the inventory build that we see every year going to look like?
Will it be as aggressive as 2022 or will it be a more lackluster inventory growth that we saw in 2023?
I don’t see it being anything like 2022. People front loaded their real estate activity due to a fast increasing interest rate environment. But I do think it will be bigger than the inventory gains that we saw in 2023.
So essentially I am thinking it will look like something in between 2023 and 2023… Which would be very similar to what happened in 2021! All projection and time will quickly tell.
Either way, inventory levels are going to remain low. They will be near all-time historical lows. And this matters because as we know, it’s inventory levels and prices that are correlated.
As of today, we have 172 fewer homes on the market than the same time in 2023 and 422 more houses on the market then we did back in 2022.
To put this all in perspective, the week before Easter we actually had 200 MORE houses on the market than in 2023.
Quick recap… So sales in the Single Family market were off by 6% while inventory was down by 14% when compared to last year’s numbers.

Home prices did exactly what we have come to expect in the Spring. It is following the trend perfectly. And prices will be up month over month next month as well. It’s going to continue until June. Then it will start pulling back.
Year over year, prices were up by 7%.
March was another great month for Massachusetts homeowners.
We have the condo market and the Multi-Family market up next…But first, any chance you can do me a huge favor as it helps play with the youtube algorithm? Can you hit that like button? It just makes a huge difference to me as well as my channel.
For the month of March, we saw 1,191 condos close in Massachusetts for an average sales price of $711k thousand dollars.
Let’s start with the sales data…

After a half percent year over year increase last month, we are back to our old games with sales levels being down.
We sold 1,191 condos in Massachusetts for the month of March. This was a 10.5% decrease over the 1,330 condos that sold in March of 2023.
Year to date we have seen a decrease in sales levels of 13% for condos in Massachusetts.

Like the Single Family market, we fell short in March. We would need to go back to March of 2015 in order to be at a sales level that is equal or less then the levels we saw in March of 2024.
The 1,191 units sold is not pretty, but it isn’t ugly either. I just don’t’ get wrapped up into sales levels like other people do. Inventory matters so much more.

Just like in the Single Family market, you saw inventory levels pull back for the last week of March which is throwing off the data.
The inventory levels of 1,985 condos on the market at the end of March is a 5% decrease in inventory levels year over year. These inventory levels are really higher and we will be able to visually see that in the weekly inventory comparison.
Comparing our inventory levels to the 2015 when we last had similar sales levels, then that would mean that inventory levels are only 1.7 times higher than they are today.

Here is where you can really see the inventory growth in the condo market.
The year over year inventory gap gives a better illustration of the increase that we have been seeing in the condo market for the last month of March.
As of the end of the month, we had 10 more condos on the market compared to the end of March in 2023 and 241 more when compared to the end of March of 2022.
I think a better representation of the inventory levels in the marketplace are when you look at the numbers the week before the end of the month. At this time you had 163 more condos on the market then compared to 2023 and 406 more then when compared to 2022.
As a year over year comparison… Sales were down by 10.5 percent, but the amount of new listings were down as well! This year we had 1,902 new listings hit the market in March. This is compared to the 2,212 that hit the market in March of 2023. Last month new listings were up by 16%. But this month they are down by 14%!

Home prices were up in March which was to be expected.
The average sales price of $711k was 7.5% higher than the average sales price in March of 2023 when it was $662 thousand dollars.

It was another strong month for condo appreciation. And it was a great way to finish off the first quarter of 2024.
The condo market remains strong. It’s going to be a good year for condo owners in Massachusetts for 2024.
And now for my very quick shameless plug. If you are thinking about buying or selling a home, then reach out to me today as I would be honored to help guide you through the process.
Now onto the Multi-Family market…
The Multi-Family market had another GREAT month as it ended the first quarter of 2024. 2023 what? Ya, that’s pretty much the Multi-family markets thoughts on that year.
In March of 2024 we saw 402 Multi-Family units sell for an average sales price of $798k.

Just like the Single Family and Condo market, the Multi-Family market also saw a year over year decline in sales levels.
The 402 units sold was a 8.6% decrease in the year over year sales levels for March.
Year over year sales levels are down 2.6%.

The 402 sales puts us on the sales levels of March of 2015. Just like the condo market!
Again, I am not losing sleep over the lower sales levels. It’s the inventory levels that matter the most. So let’s take a look at the inventory levels.

Broken record here. Inventory levels are down, but a big asterisk mark next to it.
Inventory levels at the end of March of 2024 vs March of 2023 was down 11.5%. But take a look at the year over year weekly comparison.

Inventory levels were down, but the last couple weeks they had been above the inventory levels in 2023.
The amount of new multi-families coming to the market was up… A little. New Listings levels were up by less than one percent year over year as there were 585 newly listed Multi-Family properties in February of 2024 compared to the 590 in March of 2023.
When you compare our inventory levels today to those of March of 2015, then today there are 2.9 times fewer Multi-Family properties on the market.

It was a great month for Multi-family properties in Massachusetts. We eeked out the March 2022 sales price high and actually hit the second highest average sale price… ever!
Prices were up year over year by 9.9% in March.

It’s been a great quarter for Multi-family property owners in Massachusetts..
When you look at the first quarter year over year stats, then multi-family pricing is up by 9.5%. Those are some strong gains for multi-family property owners.
It continues to be a favorable trend for multi-family property owners and welcomed news after the turbulent 2023.
Want to talk about your personal real estate needs?
Again, it’s Jeff Chubb. Whether you are looking to buy or sell a home in the next 9 or 90 days, then I would love to chat with you and find out about your real estate goals.
And if you know of anyone that is thinking about buying or selling a house, then I truly appreciate you passing along my information.
You can visit YouTubeRealEstateAgent.com or find all of my information in the description below!
#Massachusetts #Market #Update #April
Jeffrey Chubb
2024-04-03 16:58:05