
Top Car Brands You Can Trust in 2026
Most Reliable Car Brands for 2026 What are the most reliable car brands as we head into 2026? Today’s graphic from the Visual Capitalist ranks the most reliable new & used car brands using data from the venerable Consumer Reports. Be sure to check out their entire list. As always, stay safe and have a […]
The changes in state income taxes since 2000.
State Income Tax Changes Over the Past 5 Years How have state income taxes changed over the past 5 years? Today’s graphic from the Visual Capitalist compares how state income taxes have changed between 2000 and 2025. Stay safe, watch your wallet and have a Happy Friday!!! Hat tip to the Visual Capitalist. How […]
The way in which Americans allocate their finances
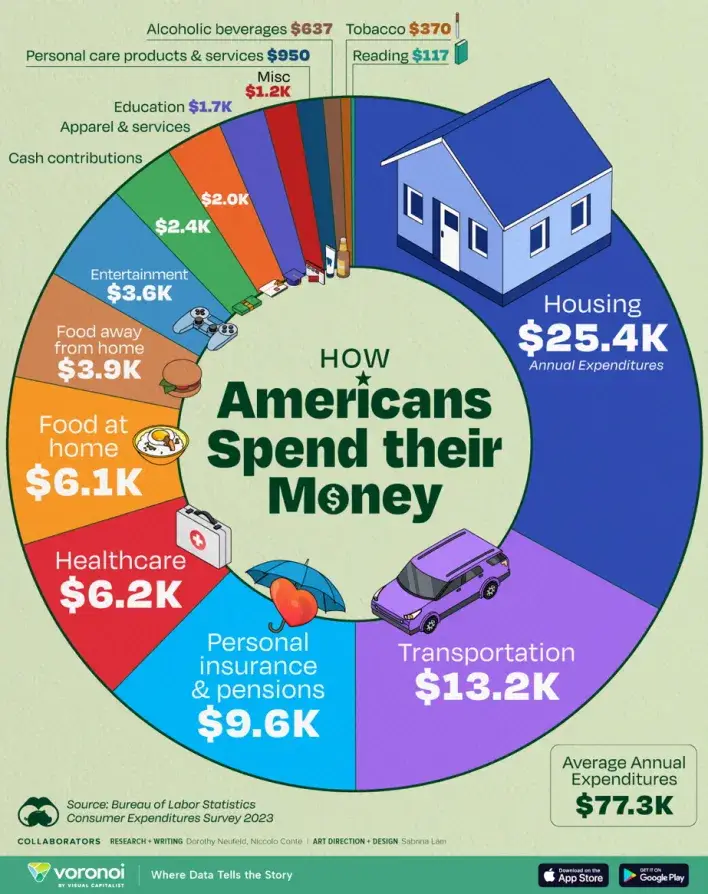
The Impact of Consumer Spending on U.S. GDP The Visual Capitalist says consumer spending represents 68% of U.S. GDP, with much of this used for housing, transportation, and healthcare costs. Today’s graphic shows the average annual expenditures of Americans, based on data from the Consumer Expenditures Survey 2023 by the Bureau of Labor Statistics. Stay safe […]
States with Cities Over 250k People

The Visual Capitalist reports that more than 80% of the American population resides in an urban area. Utilizing Census data, the infographic below highlights the U.S. states with cities boasting over 250,000 residents. Stay safe and enjoy your Friday! Hat tip to the Visual Capitalist. View infographic here The article States with Cities Over 250k […]
The Rise in Mortgage Rates

There have been multiple discussions about interest rates in the past few years. According to a graphic from Visual Capitalist, the 30-year fixed-rate mortgage has reached its highest level since 2002. This, coupled with rising home prices and limited inventory, has led to affordability being at its lowest point in history. Stay safe and have […]
What is the minimum income required to belong to the top 1% in every state, ensuring originality and avoiding plagiarism?

According to the Visual Capitalist, many people consider themselves to be middle-class, but in reality, a significant portion of them are actually part of the top 1% in terms of income. SmartAsset data shows the household income required in each state to be part of this exclusive group. Take a look at today’s graphic to […]
The Rule of 72 is a commonly used mathematical formula that estimates the time it takes for an investment to double its value based on a given interest rate.
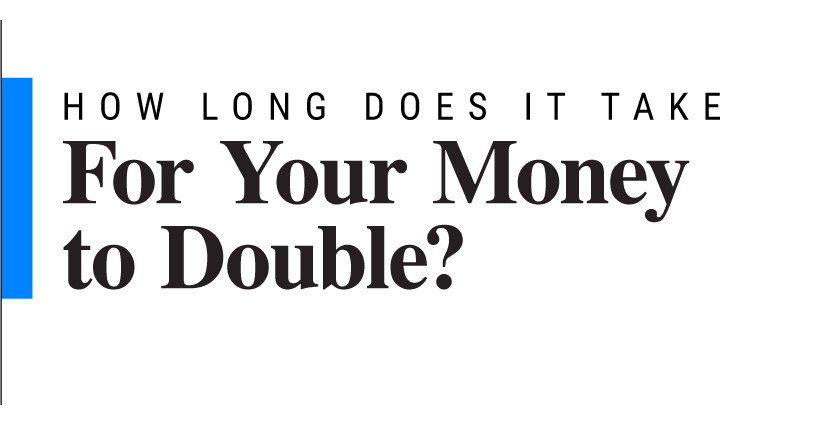
The “Rule of 72” is a fundamental principle in investing that estimates how long it takes to double your money. Instead of relying on this rule as a shortcut, there is a more precise logarithmic formula that can be used to determine the time it takes to grow your money at different annualized returns. Check […]
Countries that Hold the Most U.S. Debt

[ad_1] This is certainly something to make you go hmmmm. Today’s infographic from the Virtual Capitalist illustrates how America owes foreign investors of its national debt $7.3 trillion – all in the form of Treasury securities. Interestingly, they point out that central banks often use them for foreign exchange reserves and private investors flock to […]
U.S. Cities with the Highest GDP

[ad_1] Today’s infographic from the Visual Capitalist ranks the economic output of the top 15 U.S. cities from New York City to Minneapolis, using data from the U.S. Bureau of Economic Analysis. Interestingly, America’s metropolitan areas account for roughly 90% of U.S. economic output, however, they do point out that the economic center of gravity […]